Quote:
Originally Posted by Redroach

Central Greenland is obviously very representative. Ask the people of Kiribati about climate change, but you should'nt wait all too long! ") |
You really need to do your own research, and stop blaming yourself and man kind.
The last 10 millenia
To detail the more recent prehistoric temperature changes, scientists have drilled a number of ice cores in ancient glacial ice. Paleotemperature data from ice cores is considered to be our best continuous record of temperatures on the planet for time-spans up to about 420,000 years ago. Annual layering in undisturbed glacial ice allows us to precisely date the layers, and gives us a very accurate time and temperature sequence. The US government drilled the
GISP 2 ice core in central Greenland over a five-year period, and the
data is available here. This data set is useful because it reports temperatures (measured by oxygen isotopes) every 10 to 60 years — a good resolution. I sometimes see graphs of ice-core temperatures or greenhouse gasses that are based on measurements every 1,000 or 2,000 years: not nearly of close enough together for comparisons that are useful today. I downloaded and graphed these data in Excel myself. The following graphs have a time scale in years Before Present (BP).
The next graph of temperature from the ice core for the last 10,000 years (the current interglacial period) shows that Greenland is now colder than for most of that period (vertical scale in degrees C below zero). We can see the Medieval Warm Period 800 to 1,000 years ago was not particularly warm, and the Little Ice Age 150 to 650 years ago was one of the longest sustained cold periods during this interglacial. We are now recovering from this abnormal cold period, and the recovery started long before anthropogenic greenhouse gases were produced in any quantity. The curved trend line in green shows that we have been experiencing declining temperatures for the past 3,000 years, and are likely to be heading down toward the next ice age. Temperatures are only considered to be increasing if viewed for the last 150 years, from 1850 onward, which is roughly when thermometers began collecting global data, and is also the period of time the UN’s Intergovernmental Panel on Climate Change (IPCC) has chosen for its review. The red portion of the curve is the recovery from the Little Ice Age. The amount of 20th century warming is unknown, since it was recently revealed that unknown portions of the international temperature databases have been tampered with, and the amount and extent of the tampering has not been publicly documented. It is likely that some warming has continued into the 20th century, but it is also likely that the amount of warming is not as great as the 0.6 degrees C that the global warming advocates would lead us to believe.
Our current warming is well within natural variation, and in view of the general decline in temperatures during the last half of this interglacial, is probably beneficial for mankind and most plants and animals. The graph clearly shows the Minoan Warming (about 3200 years ago), the Roman Warming (about 2000 years ago), and the Medieval Warm Period (about 900 years ago). Great advances in government, art, architecture, and science were made during these warmer times.
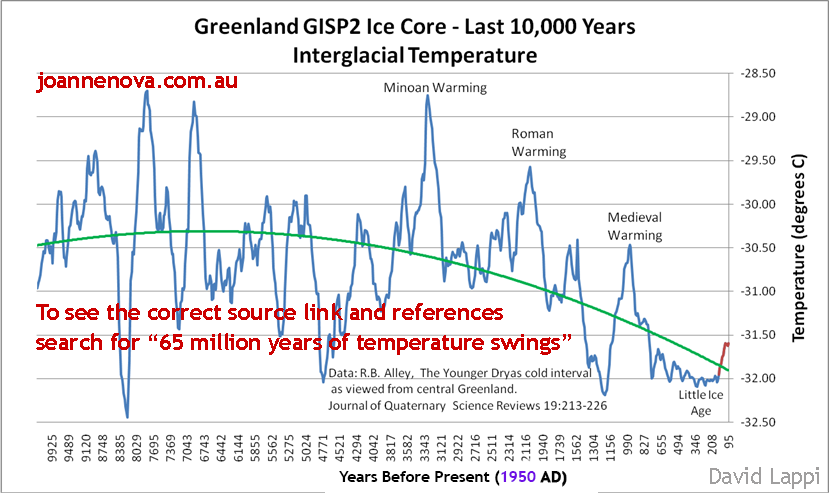
Greenland Temperatures - last 10,000 years
Long-term, temperatures are now declining (for the last 3,000 years), and we appear to be headed for the next 90,000 year ice age, right on schedule at the end of our current 10,000 year warm period. We have repeated this cycle 46 times in succession over the last 2.6 million years. And in case you are wondering, the previous Antarctic ice cores tell a broadly similar story. The following graph of ice core data from Vostok (vertical scale in degrees C variation from present) shows that Antarctica is also experiencing a long-term (4,000 year) cooling trend mirroring the Greenland GISP2 cooling trend. Though the individual temperature spikes and dips are different than in Greenland, the long-term temperature trend on the planet appears to be down, not up. And since it is so late in our current interglacial period, we could be concerned about global
cooling.
Vostok Antarctica, last 12,000 years
The US is currently drilling a new ice core (see
here), already at 1,512 meters where it is 7,700 years old, that is dated absolutely by counting annual ice layers, and each layer will be analyzed for temperature, greenhouse gases, and other constituents. This will give us the best Antarctic record yet. I believe the results will confirm the above. We geologists owe it to policy-makers to give them the benefit of our longer-term perspective. I believe we will regret regulating CO2, since doing so will not produce any measurable climate control, and may actually cause great harm to world economies. If we want to promote renewable energy sources (and I do), let us not penalize fossil fuel production and use. We may soon need all the energy we can produce, if the long-term cooling continues.
My main point is that natural variation is so large, even if we cease all emissions completely, the climate will still change (just look at the graphs). The cost of (possibly) slightly influencing this change is so great, why not spend a lot less adapting to it? Since we don’t know if the long-term climate is cooling or warming (I bet on cooling long-term), we could spend trillions to cut emissions, only to have the climate cool catastrophically on its own. What then? Pump as much CO2 into the air as possible?
Warming is not a killer, but global cooling is. It would only take a few years of global crop failures from cold weather to put populations at serious risk. Both the Antarctic and Greenland ice sheets are thickening: Leave anything on the ice, and it gets buried pretty fast (for example: the US South Pole Base was recently reconstructed because the old base was being crushed by snow and ice, and WWII planes lost on Greenland’s southeast coast, were covered by 264 feet of ice in 50 years: see the image below). This is not rocket science. Sure, the sea-level edges are retreating (that is why we call them the ablation zones of a glacier), but they represent a minute portion of the continent-scale ice mass.